 in
the tool menu bar at the left corner of screen, the layer order of thin
film can be determined by two angles method. The number of displayed
spectra must be 2, and they are taken at lower and higher emission angles.
in
the tool menu bar at the left corner of screen, the layer order of thin
film can be determined by two angles method. The number of displayed
spectra must be 2, and they are taken at lower and higher emission angles.
By clicking in
the tool menu bar at the left corner of screen, the layer order of thin
film can be determined by two angles method. The number of displayed
spectra must be 2, and they are taken at lower and higher emission angles.
Simple criterion of the layer order by two emission angles
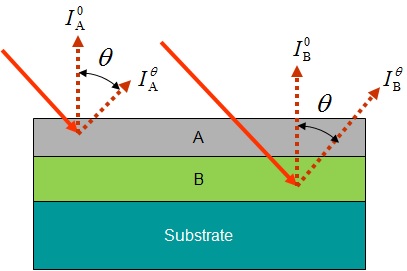
If we assume attenuation lengths of electrons from A and B are not so different, the following relation is obtained, if element [A] exists on element [B].
Therefore, the ratio of peak intensities measured at low and high emission angles indicates the layer order.
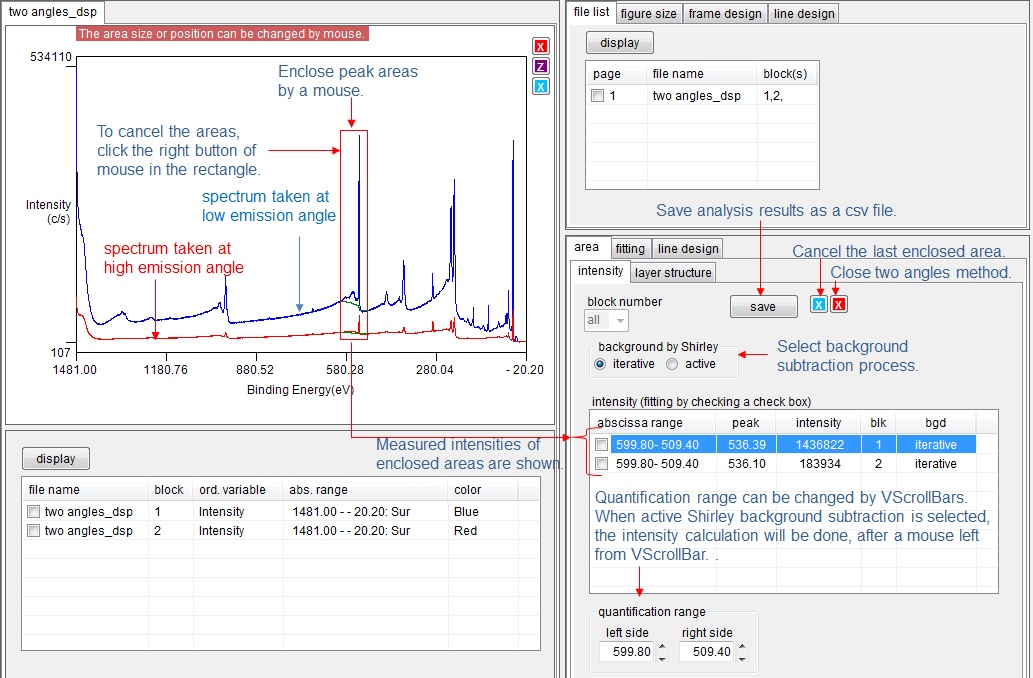
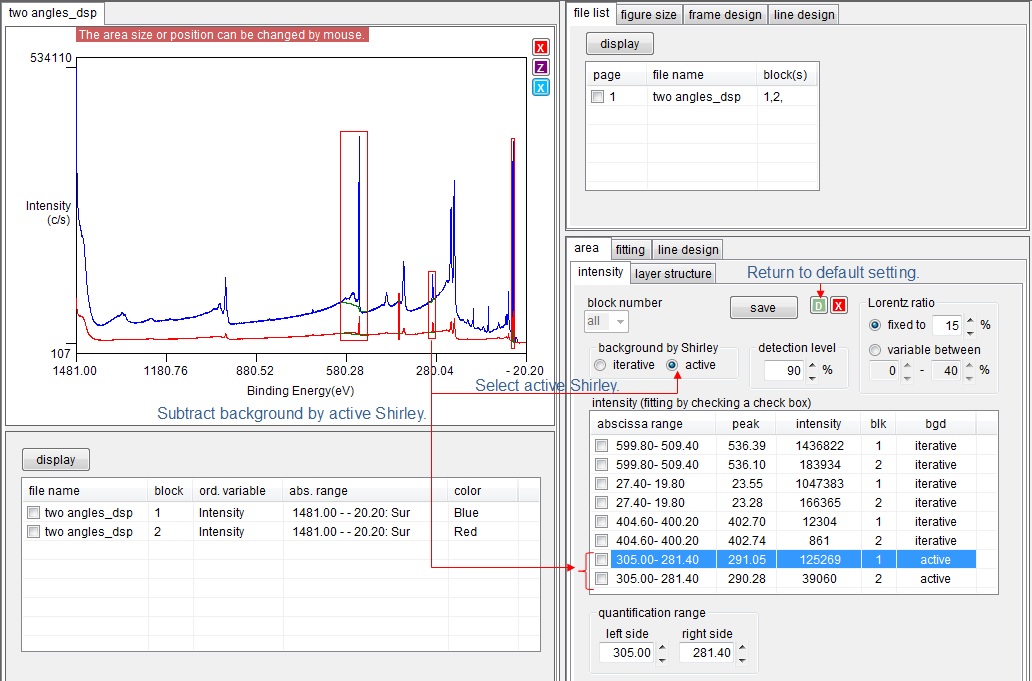
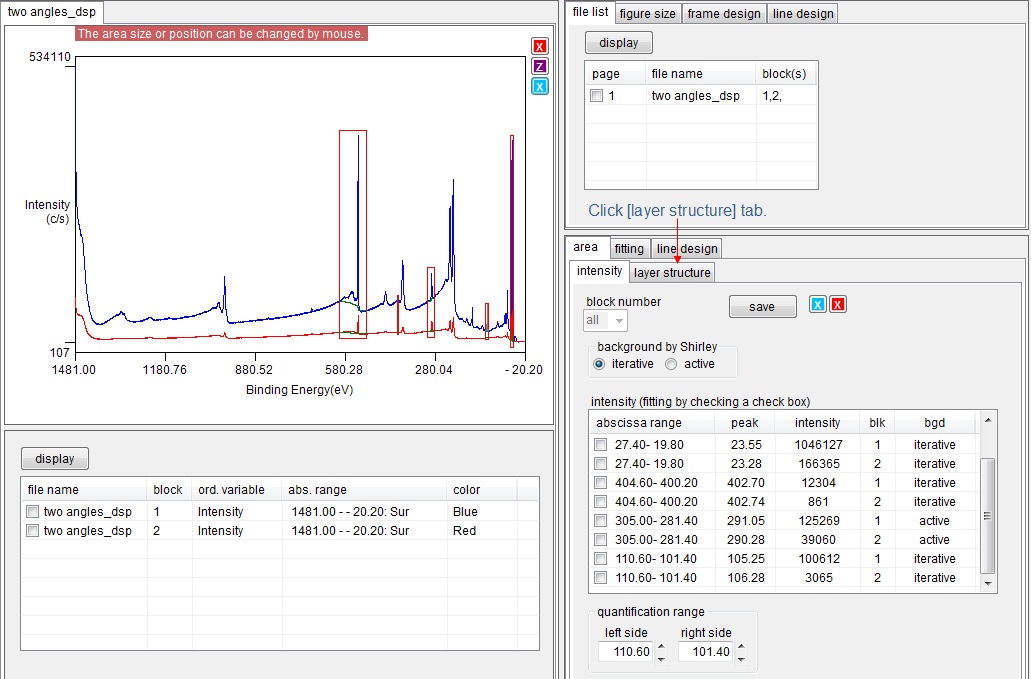
Measure intensities of peak areas
Enclose peak areas of two spectra simultaneously by a mouse. The range of enclosed area (quantification range) can be changed by VScrollBars in [quantification range] group box. When active Shirley background subtraction is selected, the intensity calculation will be done, after a mouse left from VScrollBar. The background subtraction process can be selected by radio buttons. The measured intensities are recorded in the list box. If the measured area shall be cancelled, click the enclosing rectangle by the right button of a mouse.
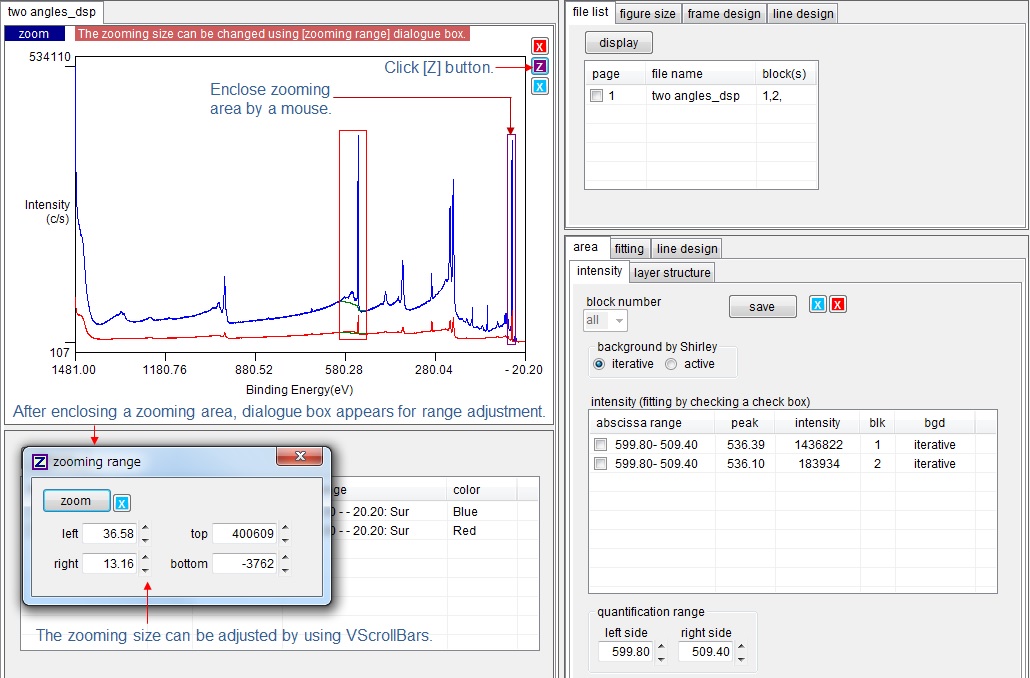
Zoom peak area
Sometimes peak area is too narrow to measure. In that case, click [Z] purple button on the figure, and enclose peak area. Again click [Z] button. Then peak area is zoomed. The zooming range can be modified by [zooming range] dialogue box.
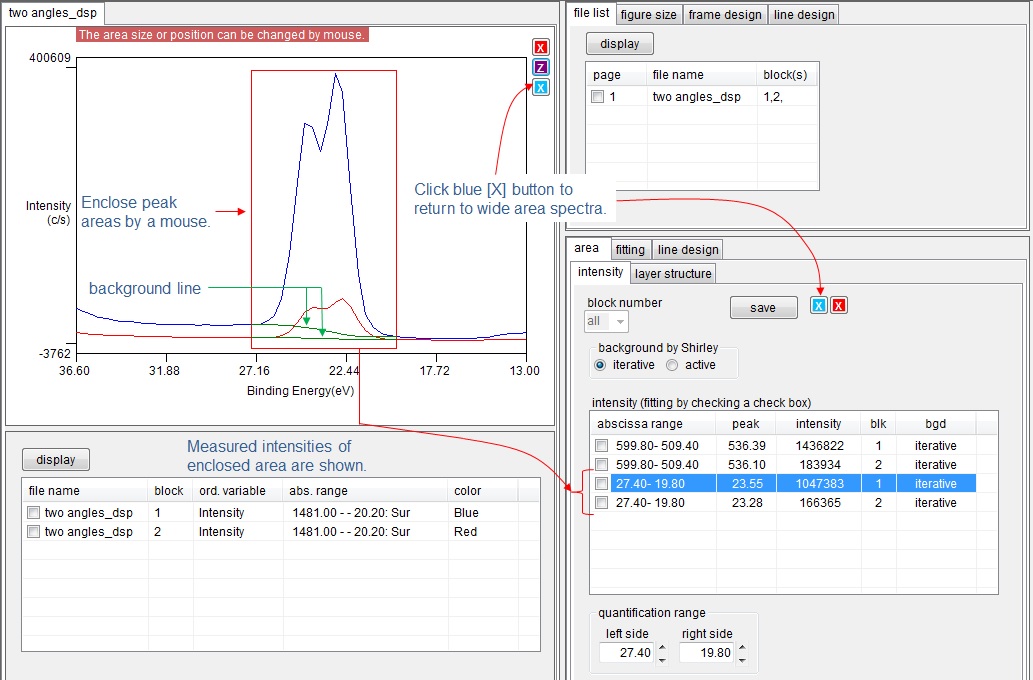
After zooming the area, enclose peak areas. Then intensities of peak areas are measured and recorded in the list box. After measuring intensities, click blue [X] button. Then figure is changed to show the wide spectra.
Background subtraction by active Shirley
Select [active] radio button in [background by Shirley] group box. Then the background of spectra is subtracted by active Shirley process. The subtract conditions of active Shirley are shown.
Fitting at peak area
When the peak area shall be fitted, check the check box of the target item of the list box.
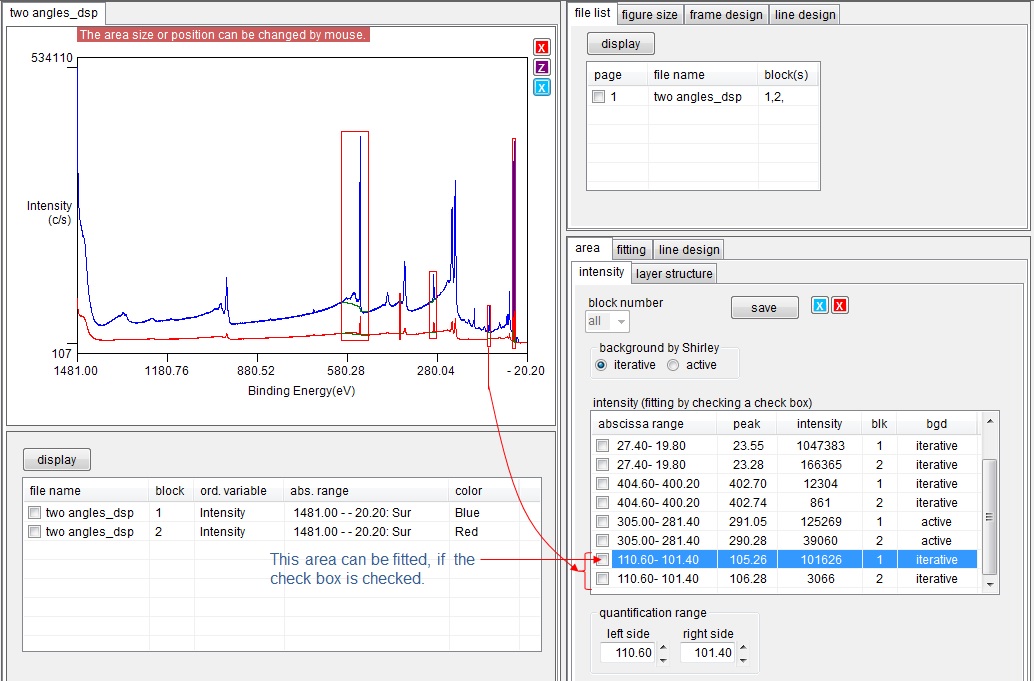
Then target peak area is fitted, and the fitting result is shown. The peak at the same abscissa range of another spectrum shall be fitted. Therefore, select another tab page for different emission angle, otherwise another spectrum is automatically peak fitted.
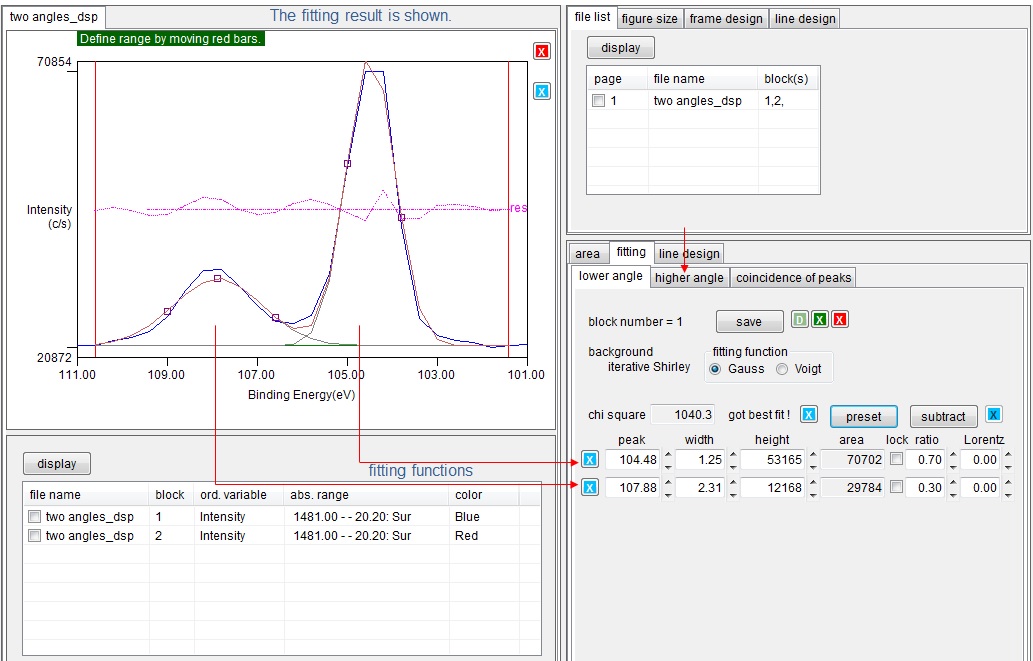
The peak of another spectrum is also fitted. But the number of peaks or peak positions may be different each other. Therefore, only coincident peak pairs are considered for peak intensity ratio. Click [coincidence of peaks] tab to check the coincidence of peaks.
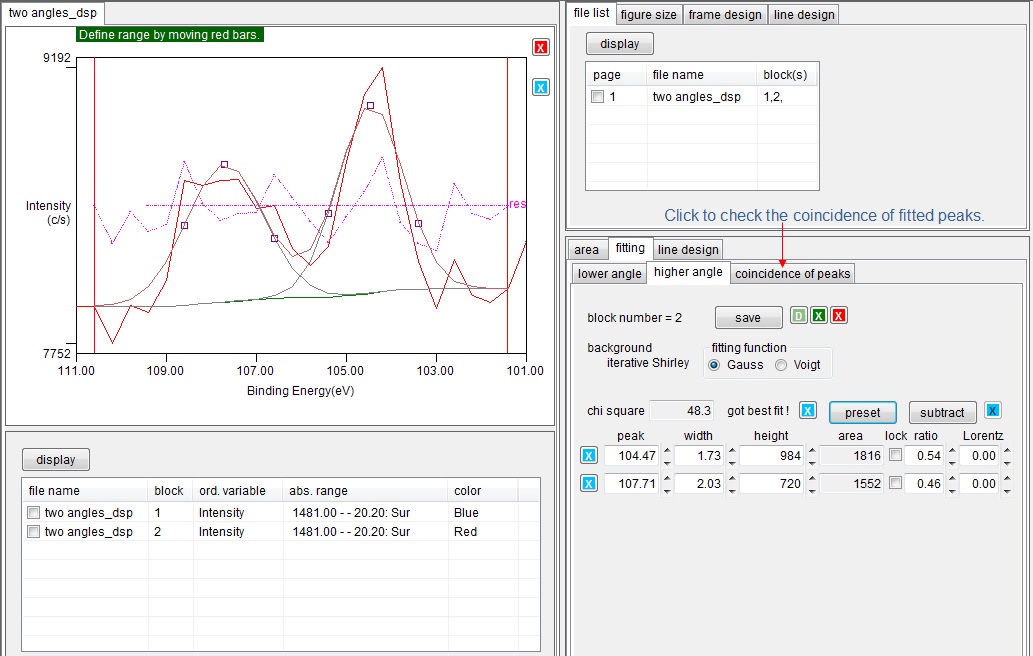
Check the coincidence of fitted peaks
The list of fitted peaks are shown. If the difference between [peak(L)] (peak energy at lower emission angle) and [peak(H)] (peak energy at higher emission angle) are less than the value of [peak discrimination level (eV)], these two peak are judged to be coincided, and the check box is checked. The discrimination level can be modified by the VScroll bar.
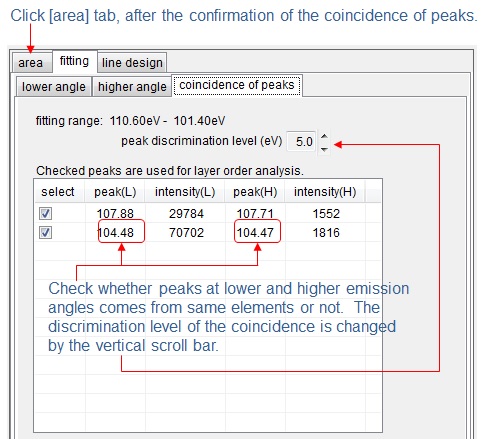
After the confirmation of coincidence, click [area] tab to show the wide spectrum. If the area is zoomed, click blue [X] button.
Layer structure
After all peaks are measured, click [layer structure] tab.
When [layer structure] is clicked, [layer analysis] tab page appears. This page summarize the intensities of two spectra (taken at lower and higher emission angles). Peak energies and intensities of both lower and higher emission angles are listed in the table. If peaks are fitted, the information of fitting functions are also listed. Each item has check box, and checked items are used for the estimation of layer order. If there is unnecessary peak for the estimation, uncheck the item.
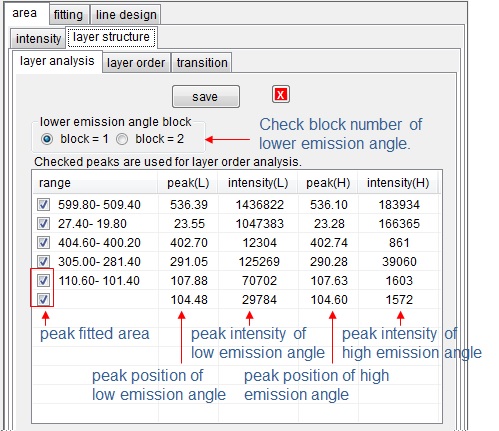
Usually the intensity of spectrum taken at lower emission angle is larger than that taken at high emission angle. COMPRO automatically detects the spectrum (block) taken at low emission angle. However, if [lower emission angle] radio button is checked, the emission angle definition can be changed.
After confirmation of checked items, click [layer order] tab. The result of two angles method is saved as a csv file, if [save] button is clicked.
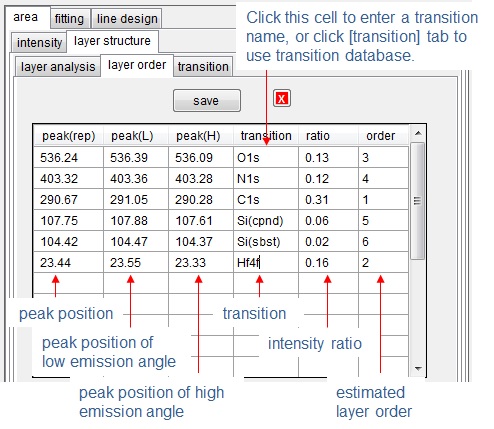
After clicking [layer order] tab, layer order is shown. [peak(rep)] column indicates the mean value of [peak(L)] and [peak(H)]. The appropriate transition name of peak can be written In [transition] column, or if that cell is clicked, the transition database will appear, and the transition name can be selected from that database. The estimated layer order is shown in [order] column.