Active Shirley
By clicking  in
the tool menu bar at the left corner of screen, the background of displayed
spectrum can be subtracted by active Shirley method. The data processing
panel appears at the right side of the figure. The subtraction conditions
are displayed in the panel.
in
the tool menu bar at the left corner of screen, the background of displayed
spectrum can be subtracted by active Shirley method. The data processing
panel appears at the right side of the figure. The subtraction conditions
are displayed in the panel.
Note: Active Shirley background subtraction is
only applied to X-ray Photoelectron Spectroscopy.
Determine
background subtraction range
A
part of the displayed range
Enclose
the background subtraction range by a mouse. The rectangle which
indicates the background subtraction range can be modified by dragging
the sides of rectangle. After the range is determined, background
subtraction starts. If blue [X] button is clicked, the range setting
is cancelled.

The whole range of the displayed spectrum
If [whole range] check box
is checked, the displayed range of a spectrum can be subtracted. After the
range is determined, background subtraction starts. If [whole
range] check box is unchecked, the whole
range setting is cancelled.
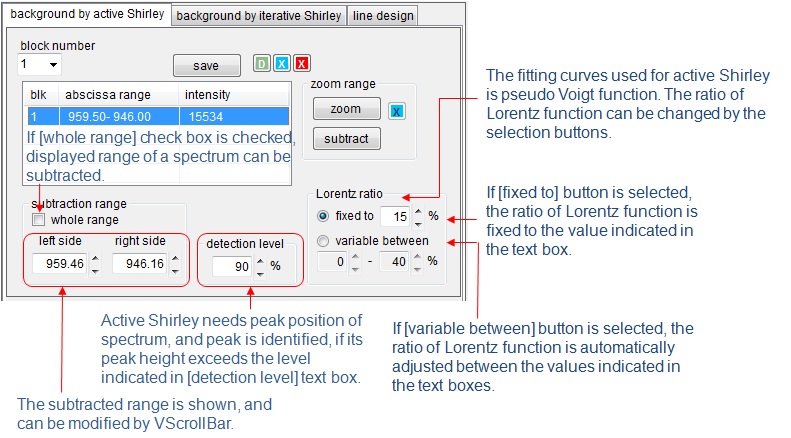
Determine background subtraction
conditions
Background
subtraction by active Shirley needs peak positions in a spectrum. A
peak is identified if its height exceeds the level indicated in [detection
level] text box (100% - [detection level]) * maximum height of spectrum).
If the differentiated peak height exceeds <(100% - [detection
level]) x [ maximum height of differentiated peak in the target range]>,
that peak is identified as a peak. The detection level can be changed
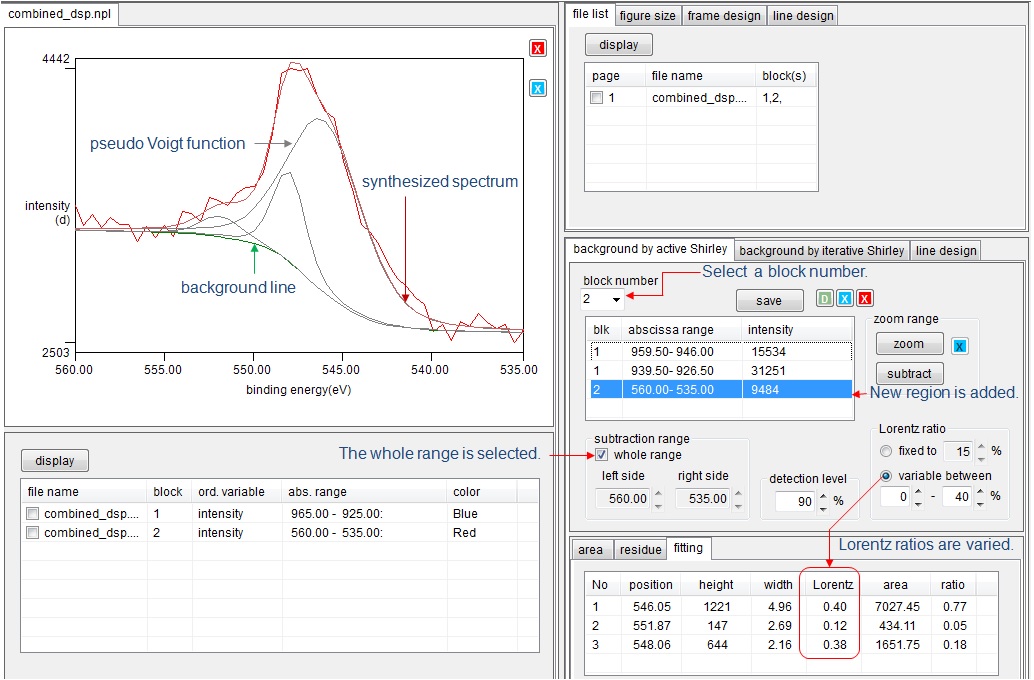
by the VScrollBar. The
fitting function used for active Shirley is pseudo Voigt function. The
ratio of Lorentz function can be changed by the selection buttons. If
[fixed to] button is selected, the ratio of Lorentz function is fixed
to the value
indicated in the text box. The value can be changed by the VScrollBar. If
[variable between] button is selected, the
ratio of Lorentz function is automatically adjusted between the values
indicated in the text boxes. The
values can be changed by VScrollBars.
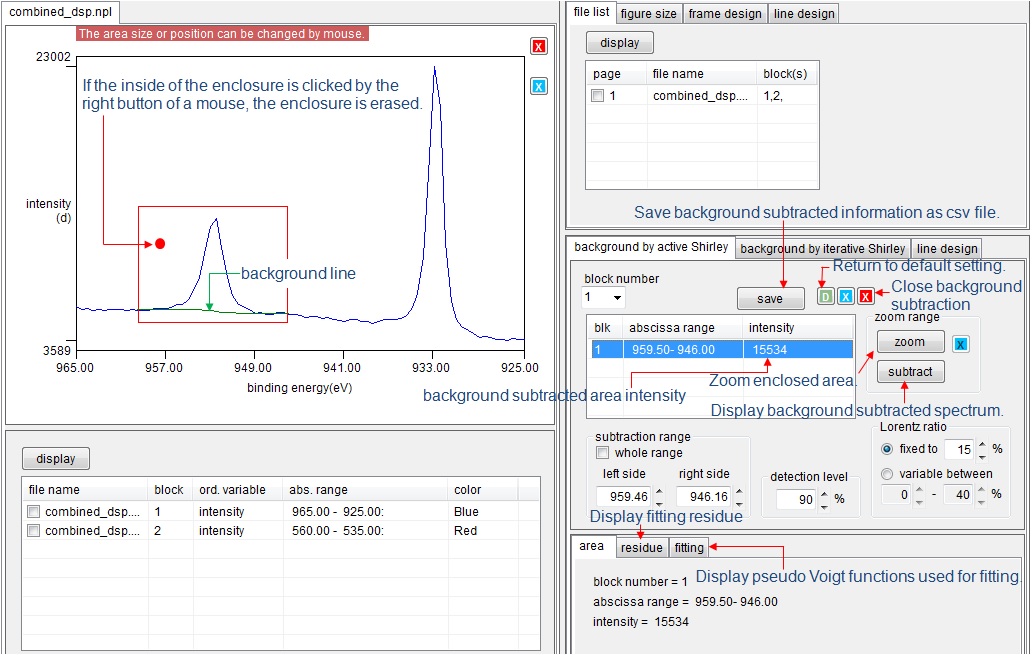
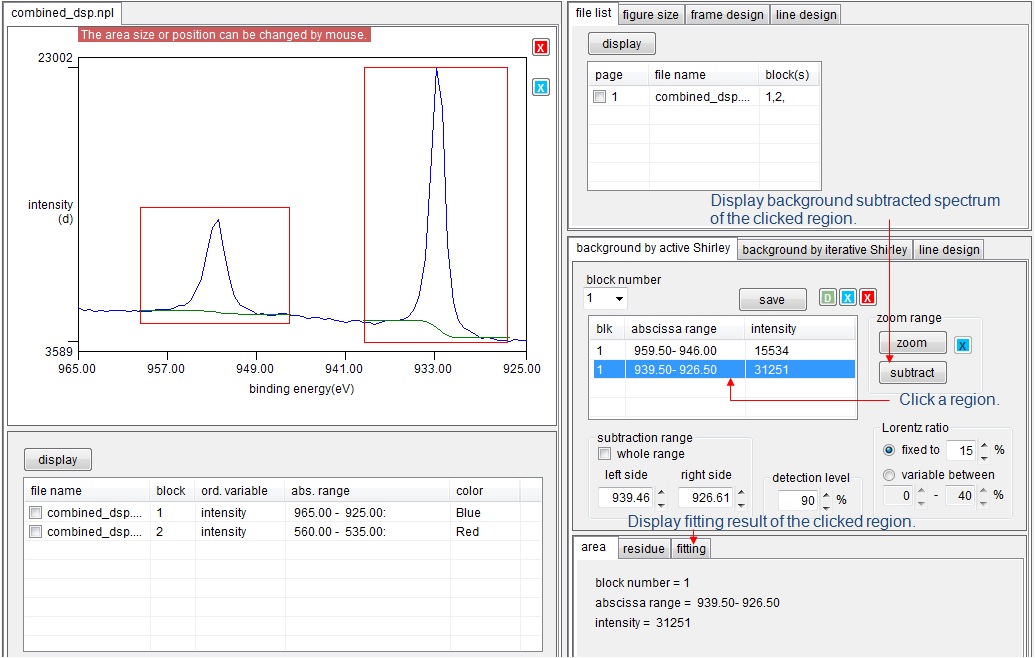
Display background
subtraction results
The background line is displayed. The
background subtracted area intensity is shown in the table. The
fitting residue is shown by clicking [residue] tab, and pseudo Voigt functions
and synthesized curve are shown by clicking [fitting] tab. If the
inside of the enclosure is clicked by the right button of a mouse, the
enclosure is erased. When [zoom] button is clicked, enclosed area
is zoomed. When [subtract] button is clicked, background subtracted
spectrum is displayed. If blue [X] button is clicked, the
original spectrum will be back.
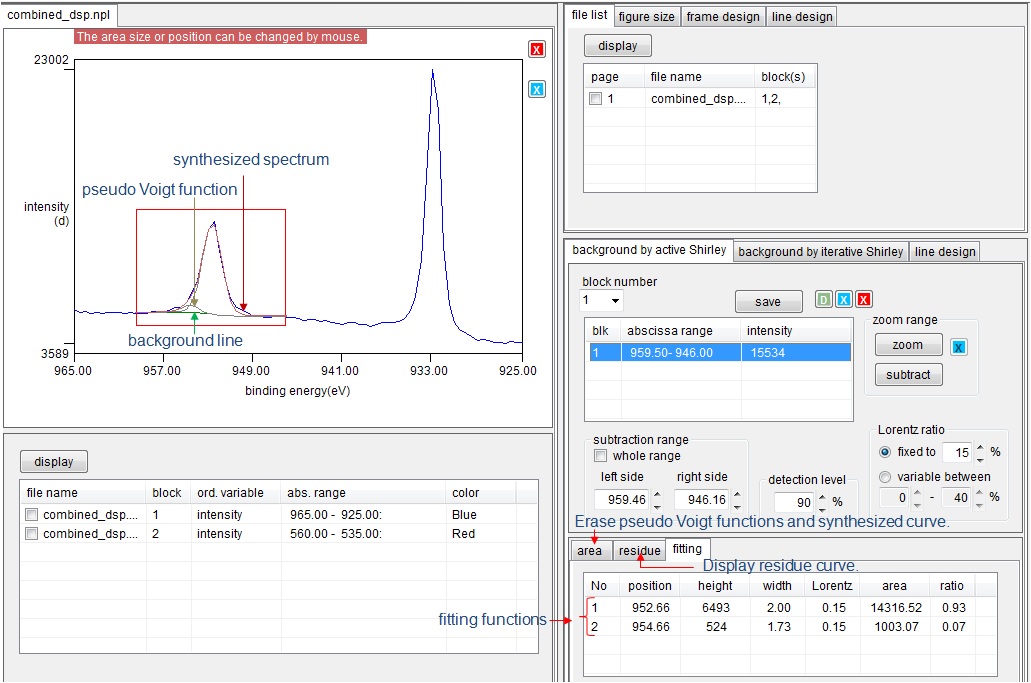
Display fitting results
When [fitting] tab is clicked, pseudo Voigt
functions and synthesized curve are overlaid on the spectrum.
Select other background subtraction
regions
When backgrounds of plural regions of a spectrum
are subtracted, the background subtraction ranges are displayed in the
list box. If one of items of the list box is clicked, the background
subtraction result of the clicked region is displayed.
Select other blocks
Select block number in the combo box [block
number], then the spectrum of the selected block number is displayed.
Enclose subtraction range or check [whole range] check box. Then
the selected region is background subtracted.
Modify
display style
Select [line design] tab. Then
display style of figure can be modified. Click
[color] button, then color pallet appears. Select any color from
the pallet, then line color is changed to the selected one. If the
[range bar (rpl. encl)] check box is checked, the enclosure is changed
to left and right bars.
Save
background subtraction results
The
background subtraction data can be saved as a csv file by clicking [save]
button. The saving items are subtraction range, the background subtracted
area intensity, background line and background subtracted spectrum.
Show the results of fitting
By selecting the [fitting] tab page, the list
of pseudo Voigt functions is displayed.
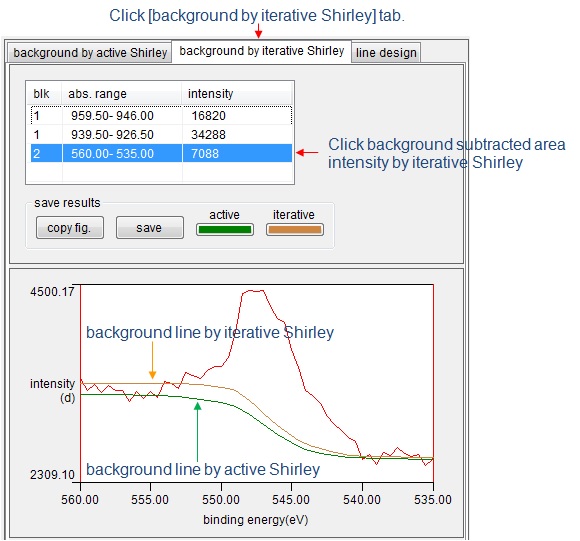
Compare the active Shirley results
with the iterative Shirley
By selecting [background by iterative Shirley]
tab page, background lines both by active and iterative Shirley are shown.
Subtraction region can be selected by clicking one of items in the
list box.